legend函数的使用方法
Matplotlib 的 Legend 图例就是为了帮助我们展示每个数据对应的图像名称,更好的让读者认识到你的数据结构。
图例通常集中于图中一角或一侧,可以使用不同符号和颜色的组合表示。
legend函数常见调用方式:
首先导入相关的库和用来创建图表的数据:
import matplotlib.pyplot as plt
import numpy as np

x = np.linspace(-4, 4, 100)
y1 = 2 * x
y2 = x ** 2
第一种:
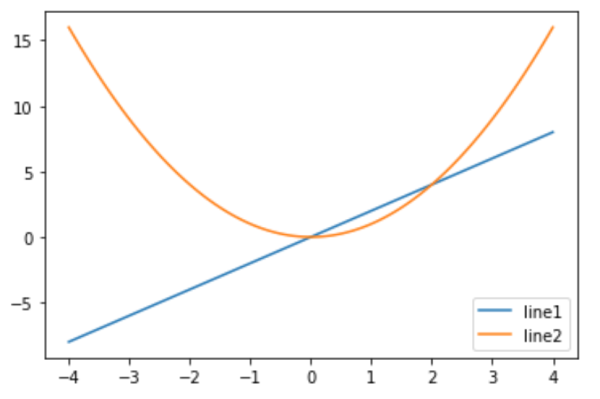
我们可以在使用plot()函数时显性定义label的内容,然后直接使用legend()画出图例:
plt.plot(x, y1, label = "line 1") # legend需要label才能展示
plt.plot(x, y2, label = 'line 2')
plt.legend()
plt.show()
第二种:
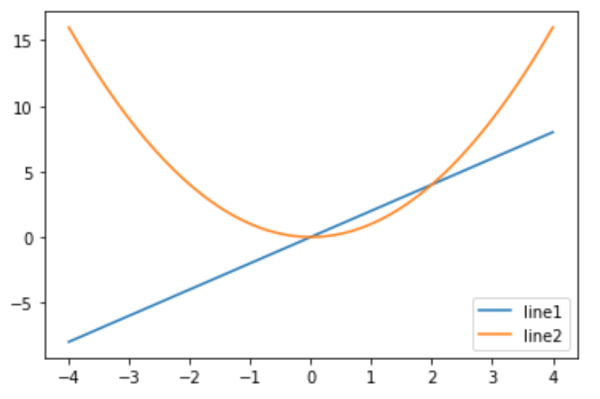
在legend() 函数中传入一个list,其中定义好数据的注明,图例会默认出现在右下角,标注不同颜色的线所代表的内容:
plt.plot(x, y1)
plt.plot(x, y2)
plt.legend(['line1', 'line2'])
plt.show()
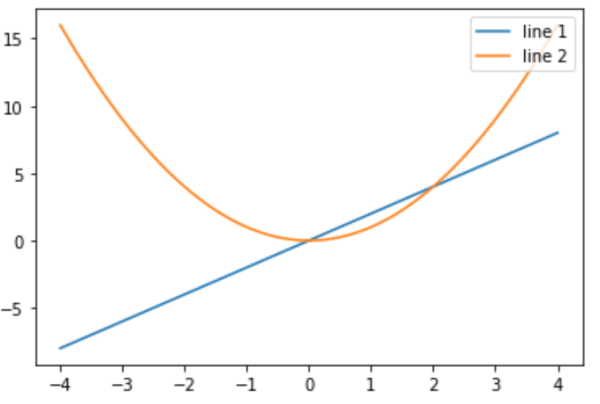
如果想要移动图例的位置,可以通过设定loc参数进行操作:
plt.plot(x, y1, label = "line 1")
plt.plot(x, y2, label = 'line 2')
plt.legend(loc = "upper right") # 其他loc参数: upper right, upper left, lower right, lower left, ...
plt.show()
loc:图例显示的位置,类型为浮点数或字符串,默认值为rcParams[“legend.loc”] ( ‘best’)。浮点数和字符串之间具有以下对应关系:
| 位置字符串 | 位置编码 |
| ‘best’ | 0 |
| ‘upper right’ | 1 |
| ‘upper left’ | 2 |
| ‘lower left’ | 3 |
| ‘lower right’ | 4 |
| ‘right’ | 5 |
| ‘center left’ | 6 |
| ‘center right’ | 7 |
| ‘lower center’ | 8 |
| ‘upper center’ | 9 |
| ‘center’ | 10 |
除了位置之外,我们还可以设置其他的参数对图例进行自定义:
plt.plot(x, y1, label = "linear line") # legend需要label才能展示
plt.plot(x, y2, label = "line 2")
plt.legend(loc = 0, title = "legend title", shadow=True, ncol = 2, facecolor = "#F5F5F5")
plt.show()
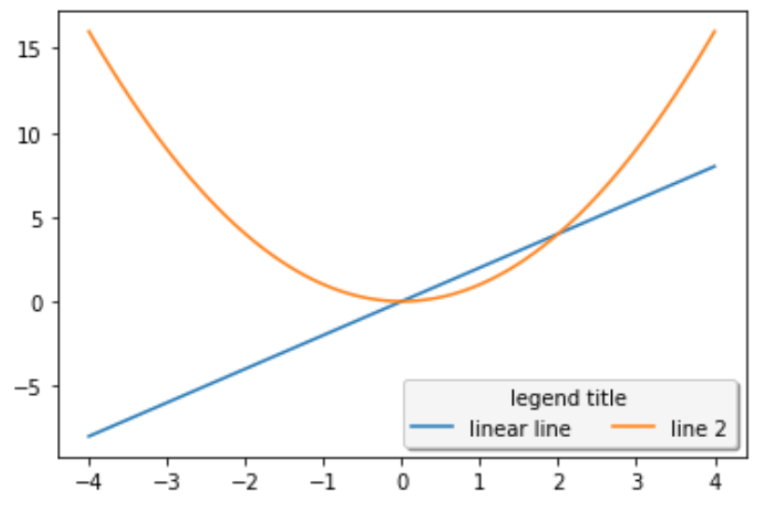
- title:图例标题。类型为字符串或None,默认值为None,即没有图例标题。
- shadow:图例区域是否有阴影。类型为布尔值。默认值为:rcParams[“legend.shadow”] ( False)。
- ncol:图例显示的列数。类型为整数,默认值为1。
- facecolor:图例区域背景色。”inherit”或 色彩值,默认值为rcParams[“legend.facecolor”] (‘inherit’)。如果使用”inherit”,使用rcParams[“axes.facecolor”] ( ‘white’)。
原创文章,作者:朋远方,如若转载,请注明出处:https://caovan.com/03-yongyushujukexuede-python-jichuzhishizhimatplotlibzhong/.html

 微信扫一扫
微信扫一扫 


